Overview
The sidebar
The sidebar is the dashboard's map. Each entry opens one screen:
| Screen | What it shows | Page |
|---|---|---|
| Overview | Key numbers, the chart, what changed, when people visit, recent journeys and the main panels | this page |
| Live | Who is on the site now | Live |
| Acquisition | Where visits come from | Acquisition |
| Activity | Visitors, Sessions, Events and Paths | Activity |
| Conversions | Goals and Funnels | Conversions |
| Revenue | Money from Purchase events. Shown only once a site has sent one | Revenue |
| AI visibility | Crawlers, AI referrals and agents | AI visibility |
| Settings | Websites, install code, assistants, API tokens, sharing, data, config | Settings |
Saved views sit under the entries. The site switcher is at the top, with Add a website. On a fresh install the first-run walkthrough opens instead.
The header
- Site: one of your sites, or all of them.
- Environment: Production, Preview or All Environments. See Environments.
- Range: the last 24 hours, 7 or 30 days, 3 or 12 months, or a custom range.
- Compare: against the previous period, a custom period, or nothing. See Compare, filter and share.
The whole state of the screen, including the open sheet, is in the address, so a link or Back brings you to the same view.
How the numbers are defined
| Number | Definition |
|---|---|
| Visitors | Distinct people with at least one non-bot event in the range. A person is the id from identify if there is one, otherwise the anonymous id. Not reset daily |
| Page Views | Pageview events in the range, including single-page-app navigations |
| Bounce Rate | 1 - engaged sessions / sessions. A session is engaged after 10 s of visible time, 2 or more pageviews, or any custom event or identify |
Each shows the change against the comparison period. Click one to chart it.
A session ends after 30 minutes without activity, and lasts at most 24 hours. A new outside referrer or new UTM tags start a new session. Sessions do not split at midnight.
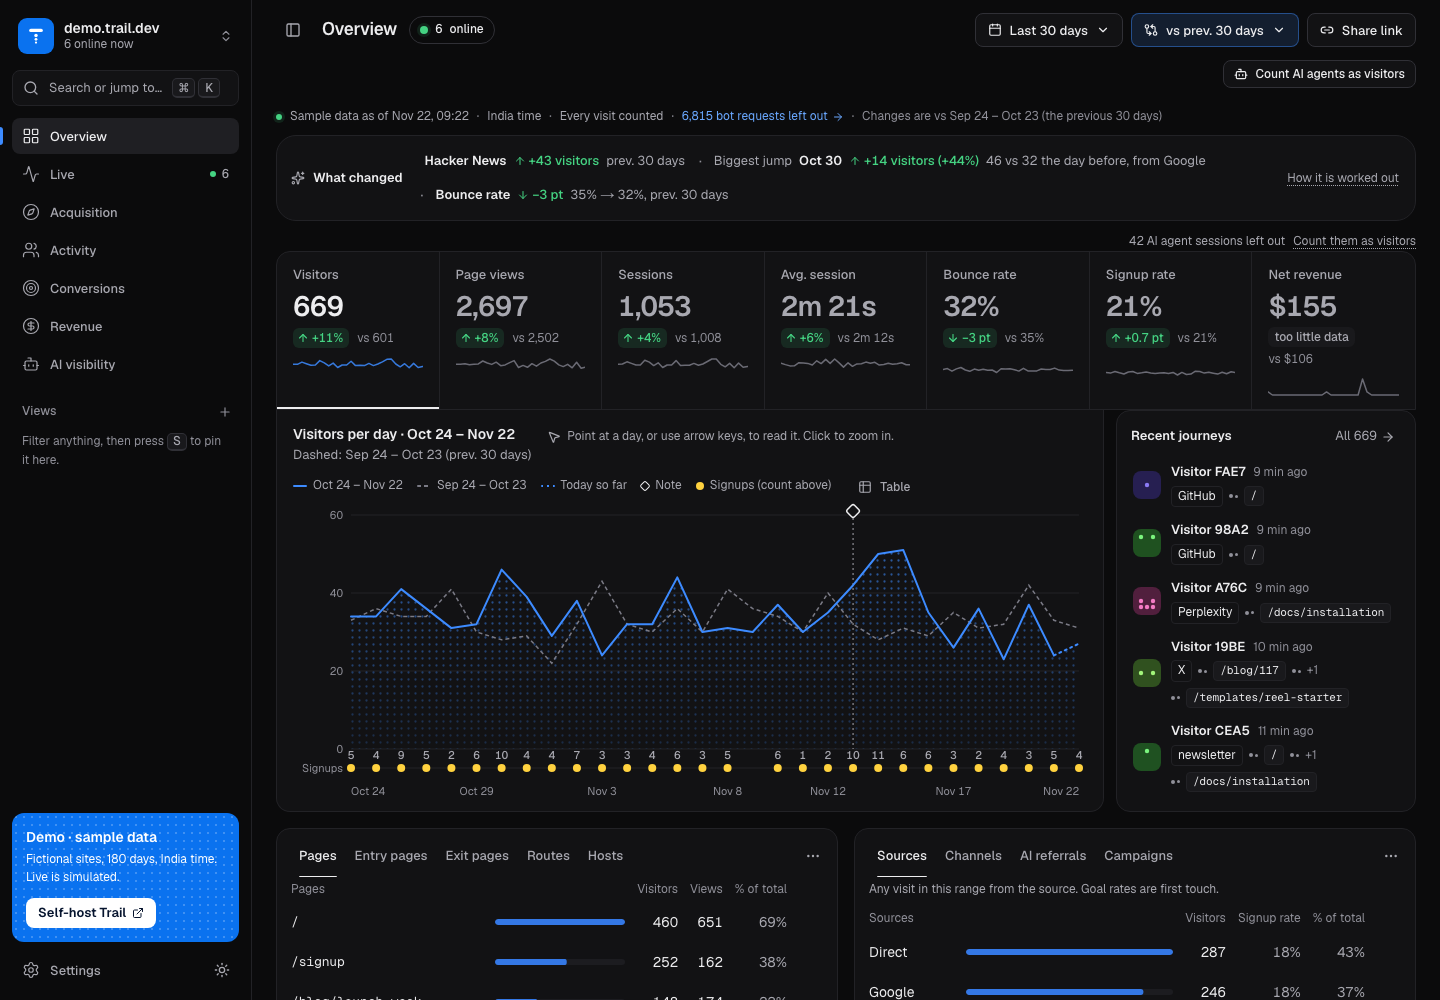
What is on the screen
- Key numbers and chart. Hover for a day's numbers against the comparison. Chart notes (for example "deployed v2") appear on the day they were added.
- What changed. The few biggest changes against the comparison period. Its How it's worked out link explains the method.
- When people visit. A heatmap of weekday and hour.
- Recent journeys. The latest visitors; click one to open the journey.
- Panels. Pages, Sources, Location, Devices, Events and Goals, each with tabs for other views of the same data. Click a row to filter the whole dashboard by it. Source filters (referrer and UTM) keep whole sessions that arrived from that source, so the pages those visitors went on to read stay in view.
The location panel shows where the network is, and a city is often that network's hub rather than where the visitor sits.
Every panel and table can export CSV and JSON from its menu, with every row.
Next
- Narrow the view: Compare, filter and share.
- Follow one person: Activity.
- Track a conversion: Conversions.